The Mobility Metrics offer insights into a community’s strength across five essential pillars of support all people need to achieve upward mobility. But local leaders need to know how to use the metrics to be able to effect meaningful change.
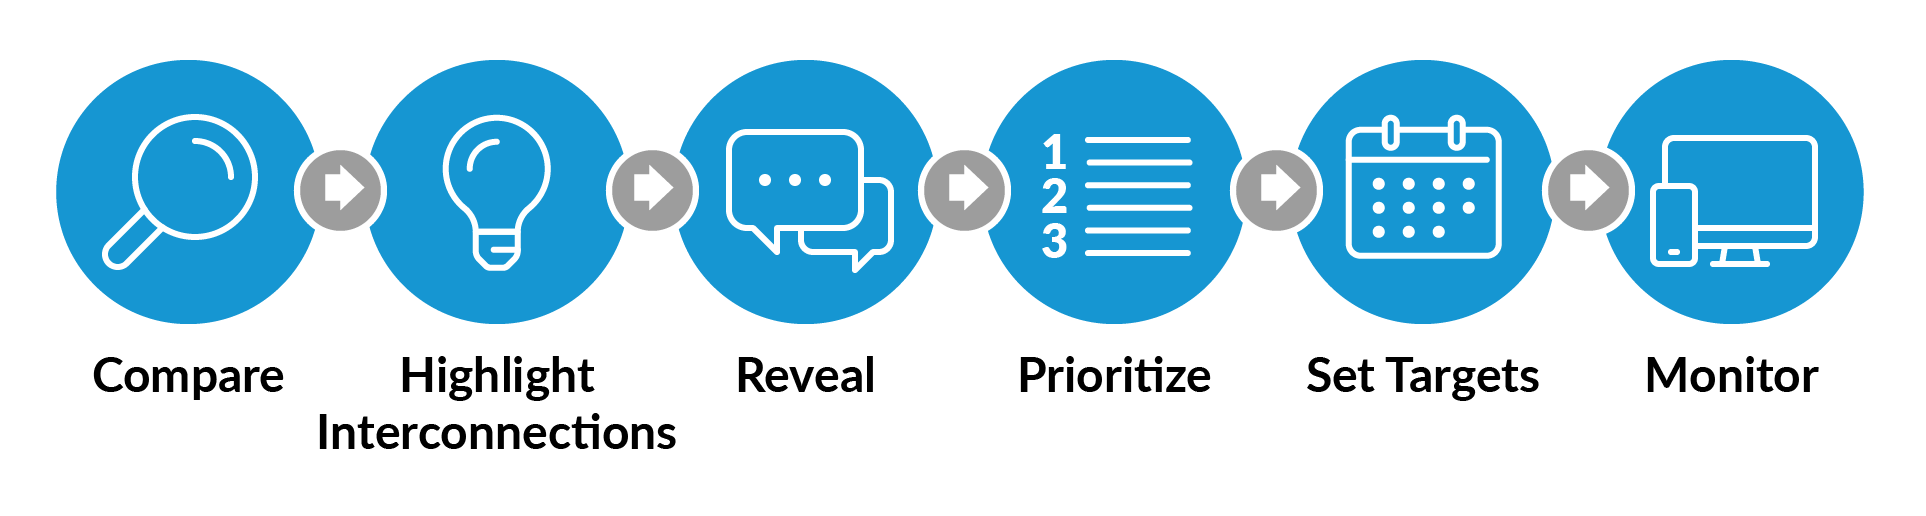
This guide highlights six ways you can leverage the metrics:
- compare your community with peer communities and national averages
- highlight interconnections across policies and supports
- reveal disparities across demographic groups
- prioritize areas of need
- set targeted goals for improvement
- monitor progress toward those goals
The six actions are sequential, with each leading into the next. We recommend moving to the next action only after you have considered the one preceding it.
Below are questions to guide you through each action, and where possible we give examples from communities that are already using the Mobility Metrics.
How to Leverage the Mobility Metrics for Local Action
1. Compare
The Mobility Metrics offer insight into a community’s strength across the five essential pillars of support identified in the Upward Mobility Framework: rewarding work, high-quality education, opportunity-rich and inclusive neighborhoods, a healthy environment and access to good health care, and responsive and just governance.
To understand the strength of each pillar in your community, select a related predictor (or all of the predictors) in the Upward Mobility Data Dashboard and view the corresponding metrics. Compare your metrics with those of similar communities to understand how your community is performing on a predictor or pillar. Those insights can then be used to build public awareness and political will to change systems and provide better supports.
Consider comparing your metrics in the following ways:
- Compare your community’s metrics with those of peer cities and counties to assess the extent of your local upward mobility challenge and to learn how others are achieving success. The Upward Mobility Data Dashboard offers a tool for comparing your community’s metrics with those of a similar community. Read the FAQs for more information about how peer communities are identified.
- Compare your community's value for a metric with the national median. We calculate a national median for each metric by sorting all counties in the nation based on their value for a metric and weighting those values by each county’s population. The value that falls in the middle is the national median, and it is calculated for every year of available data for each metric. Use these medians to understand how your community is faring on a national level.
- Identify communities with low and high values nationwide. You can learn about promising practices from communities that have successfully lifted a metric’s value and collaborate with communities with lower values to identify opportunities for growth.
After assessing and comparing the strength of the pillars in your community, move on to highlighting interconnections.
2. Highlight Interconnections
People interact with numerous systems and policies that affect their access to upward mobility every day. The pillars reflect this relationship, highlighting the interconnected, systems-level supports people need to achieve mobility.
Use the metrics to highlight interconnections within and across pillars. To do so, consider the following questions:
- How do predictors within a particular pillar affect each other? For example, within the High-Quality Education pillar, how does digital access affect preparation for college?
- How might a weak or poor-performing pillar be affecting a better-performing pillar? For example, how might a lack of opportunities in the high-quality education pillar be affecting the rewarding work pillar?
- Where can you recruit partners with expertise in different predictors to help your community leverage both its strengths and opportunities for improvement?
Community example: Washington, DC, a member of our Upward Mobility Cohort, chose to focus its efforts on three policy areas: housing, financial well-being, and workforce development and adult education. Using the predictors to visualize the mobility conditions for community members, DC’s Mobility Action Team identified ways in which these three policy areas interact. The team created a series of “resident mobility pathways,” illustrating the programs a resident might interact with as they move from economic stability to prosperity.
One pathway, “single mother sends her child to college,” laid out how a single mother might enroll in SNAP benefits, apply for a child care voucher, sign up for a city-run scholarship program, and use the city’s home purchasing assistance program, all to ultimately send her child to college. This showed how all four of these programs are interconnected and therefore should work together to help residents achieve their goals.
To break down silos between programs, the team aligned on a set of strategies to better provide wraparound services by offering supports related to child care, health care, workforce development, and affordable housing.
To learn more about DC’s work, view its Mobility Action Plan.
After highlighting interconnections across within and across pillars, move on to revealing disparities.
3. Reveal
Most of the Mobility Metrics data can be broken down, or disaggregated, for different subgroups (which we call “categories”), such as race or ethnicity and income level.
Use disaggregation to reveal persistent racial, geographic, and other inequities that may reflect structural barriers in the community. To do so, consider the following questions:
- For which predictors do you see the largest and smallest gaps between residents of different racial groups? What could be driving the size of those gaps?
- How does a predictor’s value differ for racial and ethnic groups across income levels, across age groups, and over time?
- How do the data complement or contradict what you know about current community conditions and structural barriers?
- For pillars and predictors that show large disparities, what do you know about residents’ experiences with related systems and supports? What have you learned from engaging with residents who interact with programs in this pillar?
After revealing inequities in your community, move on to prioritizing the pillars and predictors you want to focus on improving.
4. Prioritize
It is challenging to focus on every pillar and predictor with the same degree of intensity. Use the metrics to identify pillars and predictors where the community’s attention and action can have the largest effect and prioritize those areas. To do so, consider the following questions:
- For which pillars and predictors can you make the greatest impact?
- In which area is your community struggling to improve? How does this reflect the experiences of community members interacting with systems and services in a specific pillar?
- In which area is your community exceeding expectations? What might be the reason your community is doing well, and what lessons can you apply to other pillars and predictors?
- How are you defining progress in your community?
Community example: Boone County, Missouri, a member of our Upward Mobility Cohort, wanted to have community-dictated priorities inform and complement its upward mobility planning efforts. Boone County’s Mobility Action Team hosted a data walk that included a gallery of more than 20 posters displaying the Mobility Metrics and local data sources. Forty representatives from community organizations, institutions, and neighborhoods attended the event.
Together participants identified the metrics they wanted to improve. Insights from community members resulted in five initial priorities across three working areas: early grade literacy, fair and inclusive housing, and jobs and workforce development.
To learn more about Boone County’s work, view its Mobility Action Plan.
After prioritizing pillars and predictors where your community can bring about the most change, move on to setting targets for improving mobility and equity.
5. Set Targets
The Mobility Metrics are measured consistently over time and across geographies, and many are updated annually. For these reasons, you can rely on them to measure the performance of local systems and to track and evaluate your community’s progress.
Use the metrics to set targets for improving conditions for mobility in your community. To do so, consider the following questions:
- Looking at a predictor you want to improve, what are reasonable goals that can be achieved two, five, and ten years from now?
- How will you measure that change? Are there intermediate targets outside the metrics you can track to fully capture the effects of the interventions?
- How will you work to narrow inequities, and what reasonable goal can you set for doing so? Are you looking to improve conditions for the whole community, or does a gap in the data (or in any follow-on research you have conducted) suggest improvements should be targeted toward a specific group?
- What changes in the metrics will let you know you are meeting your targets as intended?
After setting targets for improving conditions in your community, move on to monitoring progress.
6. Monitor
Over time, the Mobility Metrics can be used to assess progress and hold elected officials accountable. The Upward Mobility Framework is designed to avoid measures that are overly affected by changes in a community’s population, so its metrics are effective despite demographic shifts.
When using the metrics to monitor changes, consider the following questions:
- What mechanisms does your community have in place or need to put in place to consistently track changes to its metrics as they are released?
- What local data sources can you use to supplement the metrics?
- How will you use changes in your community’s metrics to hold elected officials accountable for the commitments and investments they have made?
- Have there been positive or negative changes to a predictor’s value over time, or has the value stayed relatively the same in your community? Which policy intervention in the community or outside of it (e.g., at the state or federal level) might have contributed to the change or stability?
Pairing Metrics with Local Data to Maximize Impact
The Mobility Metrics should be used to direct attention to barriers and challenges that warrant further information gathering. They are not intended to answer every question you may have about your community’s conditions for upward mobility, and they are most effective when paired with local data and insights from community engagement.
Below are three things the metrics cannot do on their own and the additional data you would need to fill the gap.
- Measure the success of individual programs or policies. The metrics are only available at the city or county level, measure changes over the medium term, and are updated annually, so they are not well-suited for evaluating a program’s effectiveness. Supplementing the metrics with short-term evaluation indicators can give you a clearer, more reliable measure of change over time. The Centers for Disease Control and Prevention explains the kinds of indicators you can use in program evaluation. See also the set of evaluation indicators (PDF) Summit County, Ohio, a member of our Upward Mobility Cohort, created to measure whether its strategic actions were meeting their goals.
- Measure whether a resident is better or worse off because of a policy intervention. The metrics capture only community-level conditions over time, not whether policy and program changes improve or worsen a person’s life. To evaluate individual-level outcomes, you should collect administrative, program, and qualitative data, such as surveys of or focus groups with residents.
- Determine solutions to community challenges. The metrics can give you context for the challenges your community is facing, but they cannot identify solutions. To come up with solutions, you need deeper insights into the root causes of those challenges, analysis of your community’s assets and strengths, and an understanding of residents’ priorities—all of which should be informed by the perspectives and wisdom of people with lived experience of dealing with those challenges.
Follow the six steps above and understand when to supplement the Mobility Metrics with local data to accurately assess conditions for upward mobility in your community and gather meaningful insights.
For additional support with strengthening and further analyzing your community’s metrics, review the following resources:
