
Understanding local mobility conditions is an important step toward identifying strategies to improve those conditions, which we discuss in chapter 5. Data-informed decisionmaking is one of our six upward mobility principles because quantitative and qualitative data can help you understand current and historical conditions, prioritize areas that most need support, and ultimately make informed decisions that can contribute to boosting upward mobility and reducing inequities in your community.
Collecting data is not an end in and of itself, however—the aim of this chapter is for you to gather the data required for your team or coalition to come to an understanding of the key barriers to upward mobility in your community. Assessing local mobility conditions may involve multiple cycles of gathering data and engaging with community members and other stakeholders. People with lived experiences of structural racism, poverty, disability, and other barriers are important sources of local knowledge, and incorporating their insights can increase the rigor and relevance of both quantitative and qualitative research. We discuss methods for learning from community members in chapter 3.
Keep reading to learn how to use our Mobility Metrics, gather additional quantitative and qualitative data to form an initial narrative about mobility conditions in your community, and determine what’s next.
Using the Mobility Metrics
The Mobility Metrics offer ways to measure each of the 24 predictors in the Upward Mobility Framework over the short and medium terms. The Urban Institute developed the predictors and metrics in collaboration with a working group of distinguished academics from diverse disciplines and continues to update them to better reflect both new research and the priorities of communities working to advance upward mobility locally. Learn more about how we developed the framework in our report on Boosting Upward Mobility: Metrics to Inform Local Action, Second Edition.
The Mobility Metrics draw on nationally available sources to provide reliable, consistent, and easily comparable data that you can use to surface your community’s areas of strength and areas for improvement across policy domains such as employment, housing, health, and education. They can help you understand local mobility conditions in your community by
- revealing disparities across demographic groups,
- contextualizing your community’s performance by offering comparisons to peer communities and national statistics, and
- highlighting interconnections across predictors and policy areas.
You can access the Mobility Metrics data through the Upward Mobility Data Dashboard, by downloading them from our Data Catalog, or recreating them using the code provided in our public GitHub repository. The data are available for all counties in the US and for cities with more than 75,000 residents. To help illuminate racial and other disparities that may be masked by aggregate figures, we provide the Mobility Metrics data disaggregated by categories—such as race and ethnicity, age, gender, disability status, and other important characteristics—whenever possible. Disaggregated data can provide a more nuanced and representative understanding of the lived experiences of different groups of people. Beyond exposing racial and other disparities, disaggregated data also allow for better targeting of policies and programs according to the needs of different groups and more effective implementation and monitoring. The box below shows an example of the type of information you might glean from the Mobility Metrics data.
The Mobility Metric for the neonatal health predictor is the share of infants with low birth weights.
FIGURE 4-1: Share of Infants with Low Birth Weights in County A

Figure 4-1 shows that in County A, slightly under 8 percent of all babies are born with low weights (less than 5 pounds 8 ounces). One question that might immediately come to mind is whether this is true for babies of all races and ethnicities. To find out, you can look at this metric disaggregated by race and ethnicity (select the “Race/Ethnicity” category on the Upward Mobility Data Dashboard):
FIGURE 4-2: Share of Infants with Low Birth Weights in County A, Disaggregated by Race and Ethnicity
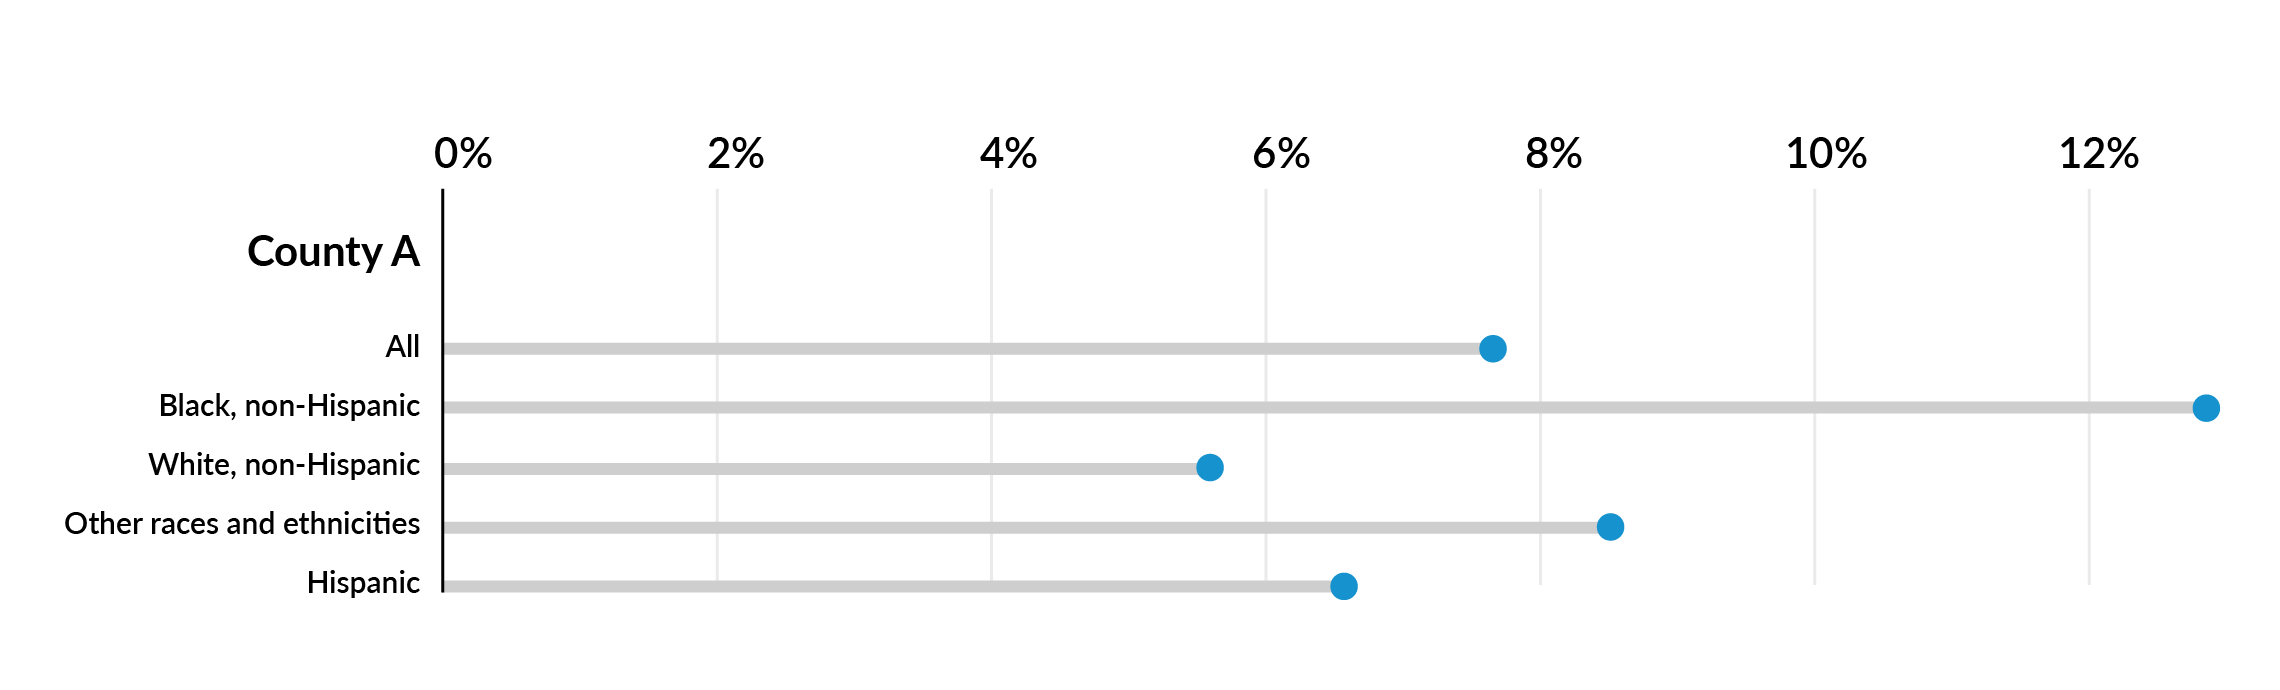
Figure 4-2 shows that less than 7 percent of white and Hispanic babies are born with low weights, compared with over 12 percent of Black babies. Disaggregating the metric by race and ethnicity paints a much more informative picture of what is happening in County A. The disparity in birth weights between Black babies and babies of other races and ethnicities reveals that neonatal health is a particularly serious challenge for Black families and highlights the importance of digging deeper to understand what conditions and challenges are contributing to this outcome. As you review your community’s data, take note of any disparities you see.
To learn more about how to leverage our suite of Mobility Metrics, visit Six Ways to Use the Mobility Metrics, and to understand how to examine and interpret a given metric for your community, view our resource on How to Examine Your Mobility Metrics.
Although we strive to provide as much information as possible, some of the Mobility Metrics rely on data that may not be available at the ideal frequency, recency, reliability, or level of disaggregation. For instance, we are unable to provide data on indigenous people or Asian Americans, because they have limited representation in the data sources we rely on. We are also only able to provide data on people with disabilities for a handful of metrics, and the data that we do provide may be missing large numbers of people with disabilities because of limitations with how the US Census Bureau and other surveyors collect this information. You can learn more about the Mobility Metrics, the criteria used to select them, and potential limitations in this appendix.
The metric for the Descriptive Representation predictor—the ratio of the share of local elected officials of a racial or ethnic group to the share of residents of the same group—is incomplete because we do not have data on the racial or ethnic makeup of local elected officials. You will need to collect this information to complete the descriptive representation metric for your community. Refer to this worksheet to learn how to do so.
Because of these limitations, we suggest using the Mobility Metrics as a starting point for understanding local conditions and pairing them with supplementary local data and insights from your community whenever possible. This may include quantitative administrative or survey data; historical records about policies and programs that may have created structural barriers to equity and mobility from poverty; and qualitative information gleaned from surveys, focus groups, and other community and stakeholder engagement activities. Assembling insights from these different data sources can help you identify the root causes underlying the problems and successes you witness or diagnose.
Once you have reviewed the full suite of Mobility Metrics for your community and examined specific metrics that stand out, make a list of what else you need or want to know about local mobility conditions. This list of questions will help guide your search for additional quantitative and qualitative data in the next two sections. You may not need to gather the data from scratch, however, as some of this information might already exist. Consult the members of your coalition to learn about what insights are already available and where you might be able to find that information.
Gathering Additional Quantitative Data
The Mobility Metrics are based on data from nationally available sources, which makes it easy to see how your community compares to other places across the country. But this means that the data are limited when it comes to the set of variables included and their specificity to local contexts. They are also only available at the county and city levels. As a result, you may need to collect additional quantitative data to answer more nuanced questions about your community, or to understand how conditions vary between different neighborhoods.
Collecting supplemental quantitative data can be challenging, given that many different data sources exist; the quality of available data can vary widely; and getting access to sensitive data can be a lengthy, monthslong process, especially if data-sharing or data-use agreements need to be negotiated. As such, this process should ideally be led by someone who is familiar with different types of data and has experience collecting data from a range of partners and sources, in addition to analyzing, cleaning, and visualizing them. You can learn more about the different types of actors you might want to engage in upward mobility work in chapter 2.
These resources provide more information on building a data team and writing data-sharing or data-use agreements:
- Getting the Most Out of Your Community’s Administrative Data: A series of five publications from Urban that can help states, municipalities, and local organizations identify, link, and analyze the administrative data sources in their communities to better track the outcomes of the social services they deliver.
- NNIP Lessons on Local Data Sharing: A short blog post on lessons learned about data sharing from the National Neighborhood Indicators Partnership.
- NNIP’s Collection of Example Data-Sharing Agreements: A catalog of sample memorandums of understanding and data-sharing agreements from the National Neighborhood Indicators Partnership.
In this section, we introduce three primary sources of supplemental quantitative data—public sources, private sources, and data from original surveys—and provide suggestions on how to collect data from these sources.
Collecting Additional Publicly Available Data
We suggest specific sources of publicly available quantitative data in our resource on Obtaining More Local Data. However, the following are generally reliable places to start when looking for public data to supplement the Mobility Metrics:
- Census data: National census data provide a wealth of demographic information, beyond those used to construct the Mobility Metrics.
- Government websites: Local, state, and national government websites often provide access to a wide range of public data, including demographic information, economic data, and public records.
- Open data portals: Many governments have open data portals, where they share datasets on topics such as transportation, education, health, and more. One data portal example is data.gov.
- Public libraries: Local libraries may have relevant resources and data available to the public, which librarians can assist with locating.
- Community organizations: Nonprofit organizations and community groups may collect and share data related to local issues.
- Educational institutions: Universities and research institutions publish research and data in various fields. Academic libraries and online repositories are good places to explore for more information.
- Local newspapers and magazines: Local publications may conduct investigations and collect data on community issues. Archives of newspapers or magazines can be a valuable resource.
- Community surveys: Some communities conduct surveys to gather information on topics that are important to residents. Look for survey results published by local government or community organizations.
The San Mateo, CA, Mobility Action Team is led by the Shared Prosperity Coordinating Council (SPCC), a diverse multisector group of leaders convened by the County of San Mateo to advance equity and shared prosperity in a county that suffers from significant disparities in income and opportunity. The SPCC grounded its Economic Mobility Action Plan in the Upward Mobility Framework and added six additional elements—ranging from job training to system navigation support—based on input from three countywide community engagement efforts that heard from more than 5,500 residents in 12 languages.
After reviewing data on the full suite of Mobility Metrics, the SPCC developed locally relevant universal goals across the three dimensions of upward mobility. Then, through an analysis of local human services data and Census data and a partnership with the Public Policy Institute of California, the SPCC was able to identify groups furthest from meeting its universal goals. Using a Targeted Universalism approach, the data on priority populations, and a landscape analysis of existing local efforts to address its goals, the SPCC identified seven strategies to fill critical gaps to boost shared prosperity.
Collecting Additional Data from Other Sources
In addition to publicly available data sources, consider whether you have relationships with any of the following actors, who might be able to provide access to data that is not publicly available. However, when collecting data from nonpublicly available sources, you should ensure you comply with any laws that regulate the collection and sharing of data containing personally identifiable or otherwise sensitive information.
- Government partners can shed light on your community’s Mobility Metrics and provide access to additional data to supplement those metrics. They may also know of existing memorandums of understanding or data-use agreements you can leverage to access relevant information.
- Anchor institutions may hold data that can be used to assess local conditions. For example, hospitals collect data about the communities they serve in a Community Health Needs Assessment.
- Nonprofits and community-based organizations (CBOs) typically collect programmatic data to understand the success of the programs they deliver. If possible, you might consider working with a group of nonprofits and community-based organizations to systematize their collection of data so it can be aggregated at the city or county level.
- Philanthropic partners may collect data on their grantees or funding trends. They may also be able to support nonprofit and CBO partners in expanding their data collection efforts.
- Research organizations can play a key role in assessing data quality and in planning and implementing original data collection. They can also conduct evaluations on existing interventions to assess their effectiveness or impact.
- Private-sector companies can provide data that may paint a fuller picture of local economic conditions, such as data on their employees or market conditions.
- Advocacy groups can provide historical context on data and information about a specific policy issue. However, because of their nature as advocacy groups, you should consider other sources of information that can complement their data advocating for a specific cause.
- Community members can suggest additional metrics or other local data sources that align with key predictors of upward mobility. They can also share their unique perspectives and help you understand whether the data align with community experiences.
Collecting Additional Data Using Original Surveys
If you are unable to identify a data source for information that you believe might be critical to understanding conditions in your community, you may want to consider conducting an original survey to collect this data or consider whether any organizations you are connected to host ongoing surveys that you can add questions to. Surveys may be particularly helpful for gathering data that are not consistently collected at the national level, such as data on social capital and data on belongingness. Conducting a survey that produces high-quality data is time- and resource-intensive, so consider the prompts outlined in this worksheet carefully to help you determine whether designing and fielding an original survey might be appropriate for your situation.
Evaluating Potential Data Sources
Once you have identified a set of potential supplementary data sources, review the questions in this worksheet to determine which sources might be worth pursuing. Keep in mind that quality is more important than quantity, and a concise set of reliable and consistent metrics is often more useful than a larger set of metrics collected at irregular intervals, which are difficult to track over time. After you’ve gathered and analyzed the supplemental quantitative data you prioritized to fill knowledge gaps, you may wish to move on to assembling qualitative information to fill any remaining gaps. We suggest potential sources and methods in the next section.
Sometimes data are not available at the level of specificity you need to observe disparities between different groups. This may be the case because there are too few data points or observations to compute a metric with reasonable accuracy, or because the data were never collected to begin with, such as when a survey or administrative data source fails to ask about race or lumps diverse groups together.
When faced with a lack of disaggregated data, it is still important to find a way to interrogate how structural racism, discrimination, prejudice, and implicit bias may be playing a role in the story the data tells. Whenever possible, you should collect local datasets that can help inform your understanding of local conditions (see our resource on Obtaining More Local Data for suggestions on where to look). Qualitative information, which can be collected from myriad sources, such as interviews, surveys, town halls, and focus groups, can also be used to better inform the context around quantitative data outcomes or gaps in information.
One option for understanding potential disparities when examining data that can be disaggregated by subgeography but not by race/ethnicity or other demographic characteristics, is to visualize it on a map and overlay relevant demographic data to examine variations that might trigger new questions or hypotheses. Visit this worksheet for an example of how to do this. Urban’s Spatial Equity Data Tool can also help you perform this analysis on your own dataset of nondisaggregated data.
Gathering and Analyzing Qualitative Data
The Mobility Metrics data and the supplemental quantitative data that you gather can tell you what conditions currently exist in your community, but you also need to assemble qualitative information to understand why conditions are the way they are. This information may include historical records about policies and programs that may have created structural barriers to equity and mobility from poverty, evaluations of existing programs and how well (or not) they are working, ecosystem maps that show networks and relationships between organizations in the mobility-from-poverty space, and information on narratives that underpin systems of power and oppression.
People with lived experiences of structural racism, poverty, disability, and other barriers are important sources of local knowledge. If your coalition is representative of your community, some members of your coalition should be able to contribute these perspectives. However, you should also seek to learn from a broader cross-section of community members as you try to paint a fuller picture of local conditions. We discuss methods for doing so in chapter 3. Below, we introduce methods for gathering and analyzing additional qualitative information.
Root cause analysis. A root cause analysis entails examining social and historical contexts to identify the root causes of the disparities and inequities you observe in the data. Performing a root cause analysis helps ensure your efforts can address the underlying problems in your community, not just their symptoms. One frequently used technique is digging deeper into a problem by asking yourself why until you are no longer able to answer the question. Consult this resource from County Health Rankings for additional guidance on how to perform a root cause analysis. As the authors of the Education-to-Workforce Indicator Framework note, “direct engagement with people with lived experience is key to conducting reflective root cause analyses that seek to identify systems drivers of disparities.” This means you should ideally perform this analysis in partnership with members of the community most impacted by existing inequities.
Contextual analysis. This refers to analyzing the many overlapping factors and local contexts that influence evidence-based policy decisions. To perform this analysis while evaluating the information you’ve collected, consider the various factors that provide context, such as the following:
- the greater political atmosphere
- historical background (e.g., regulations, first-hand accounts, population change)
- the relationship between public institutions and various relevant stakeholders
- shared assumptions and shared culture
- organizational capacity (staffing and expertise)
- regulatory environments and the momentum of management or processes
- financial, technological, and infrastructural resources
See this report developed by the National Democratic Institute for an example of this analysis in the context of political party assistance and development.
Community asset mapping. This is a tool for understanding what assets exist in your city or county that are serving community members’ needs. Various approaches to community asset mapping exist, but all are designed to capture the full landscape of opportunities, needs, and strengths in a given community. Assets may refer to institutions, infrastructure, community groups, parks, churches, grocery stores, clinics, community centers, and the talents and capacities of local residents. The key to identifying assets is to clarify what makes them valuable and for whom. Community asset mapping is also meant to empower local residents by positioning them to be their own spokespeople and to advocate for changes in the community. For further information about community asset mapping and an example of what it might look like in practice, consult the Preston City Council Community Mapping Toolkit.
Ecosystem mapping. An ecosystem refers to any network of connections between various actors, such as governments, nonprofits, and other stakeholders, relevant to upward mobility work. Mapping an ecosystem can help you visualize relationships that exist in your community and may reveal leverage points, blockages, or opportunities that aren’t obvious until you've better examined how and why certain parties interact the way they do.
Ecosystem mapping can also help you clarify roles and levels of contribution across a pipeline of partners, determine gaps in grant funding, and much more. The scope and depth of your ecosystem map should depend on the key factors you are trying to identify or deconstruct. Mapping an ecosystem with the broader community can also reveal insights from varied perspectives. For more information on ecosystem mapping methods, visit our Guide to Civic Tech and Data Ecosystem Mapping.
Narrative power analysis. This is a method for analyzing the narratives that underpin systems of power and breaking them down into constituent assumptions and components. It is based on the idea that people understand the world and their role within it through stories, and that stories have great power to either maintain the status quo or disrupt expectations of how things “should be.” See this resource about narrative power analysis for more information and use this worksheet to guide you through the process.
Determining Next Steps
The goal of this chapter is for your coalition to learn how to form an initial narrative about the critical barriers to upward mobility in your community. Once you have analyzed your community’s Mobility Metrics and identified and collected supplemental quantitative and qualitative data, you will need to come to a consensus with your team or coalition on what the data say about the conditions in your community and the key barriers to upward mobility.
To help build this narrative, you may wish to convene as a group to discuss what you learned and how to interpret it. In advance of this meeting, it may be helpful to put together a brief summary for each issue you gathered data on to frame the discussion. These summaries should ideally interweave quantitative data with qualitative data and tell a story about how current conditions (both good and bad) were created in your community, how they are being sustained, who they affect most, and what outcomes they’re leading to. It may also be helpful for your coalition to vet your initial findings with a broader cross-section of community members, which you can learn how to do in chapter 3.
The gaps and uncertainties in your emerging narrative will highlight where you will need to invest time and effort in gathering more and/or different information. Some of this information may come from additional quantitative data, in which case you may repeat some of the exercises in this chapter. Some information may come from qualitative data that can only be gleaned from continued engagement with community members or other stakeholders. Gaining an understanding of local mobility conditions is only one step in the process of boosting upward mobility, however. To improve those conditions, you will also need to identify the actions your coalition can take to advance mobility and address inequities, as well as ways you can sustain work over the long term. Chapter 5 and chapter 7 can guide you through these activities.
View next chapter